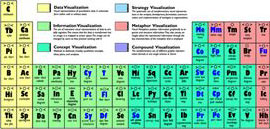
The 17th User Experience Newsletter features “A Periodic Table of Visualization Methods”. It's a wonderful collection and classification of different chart types for very different occasions... (read more)
Sep 28, 2007
Subscribe to:
Post Comments (Atom)

0 comments:
Post a Comment